

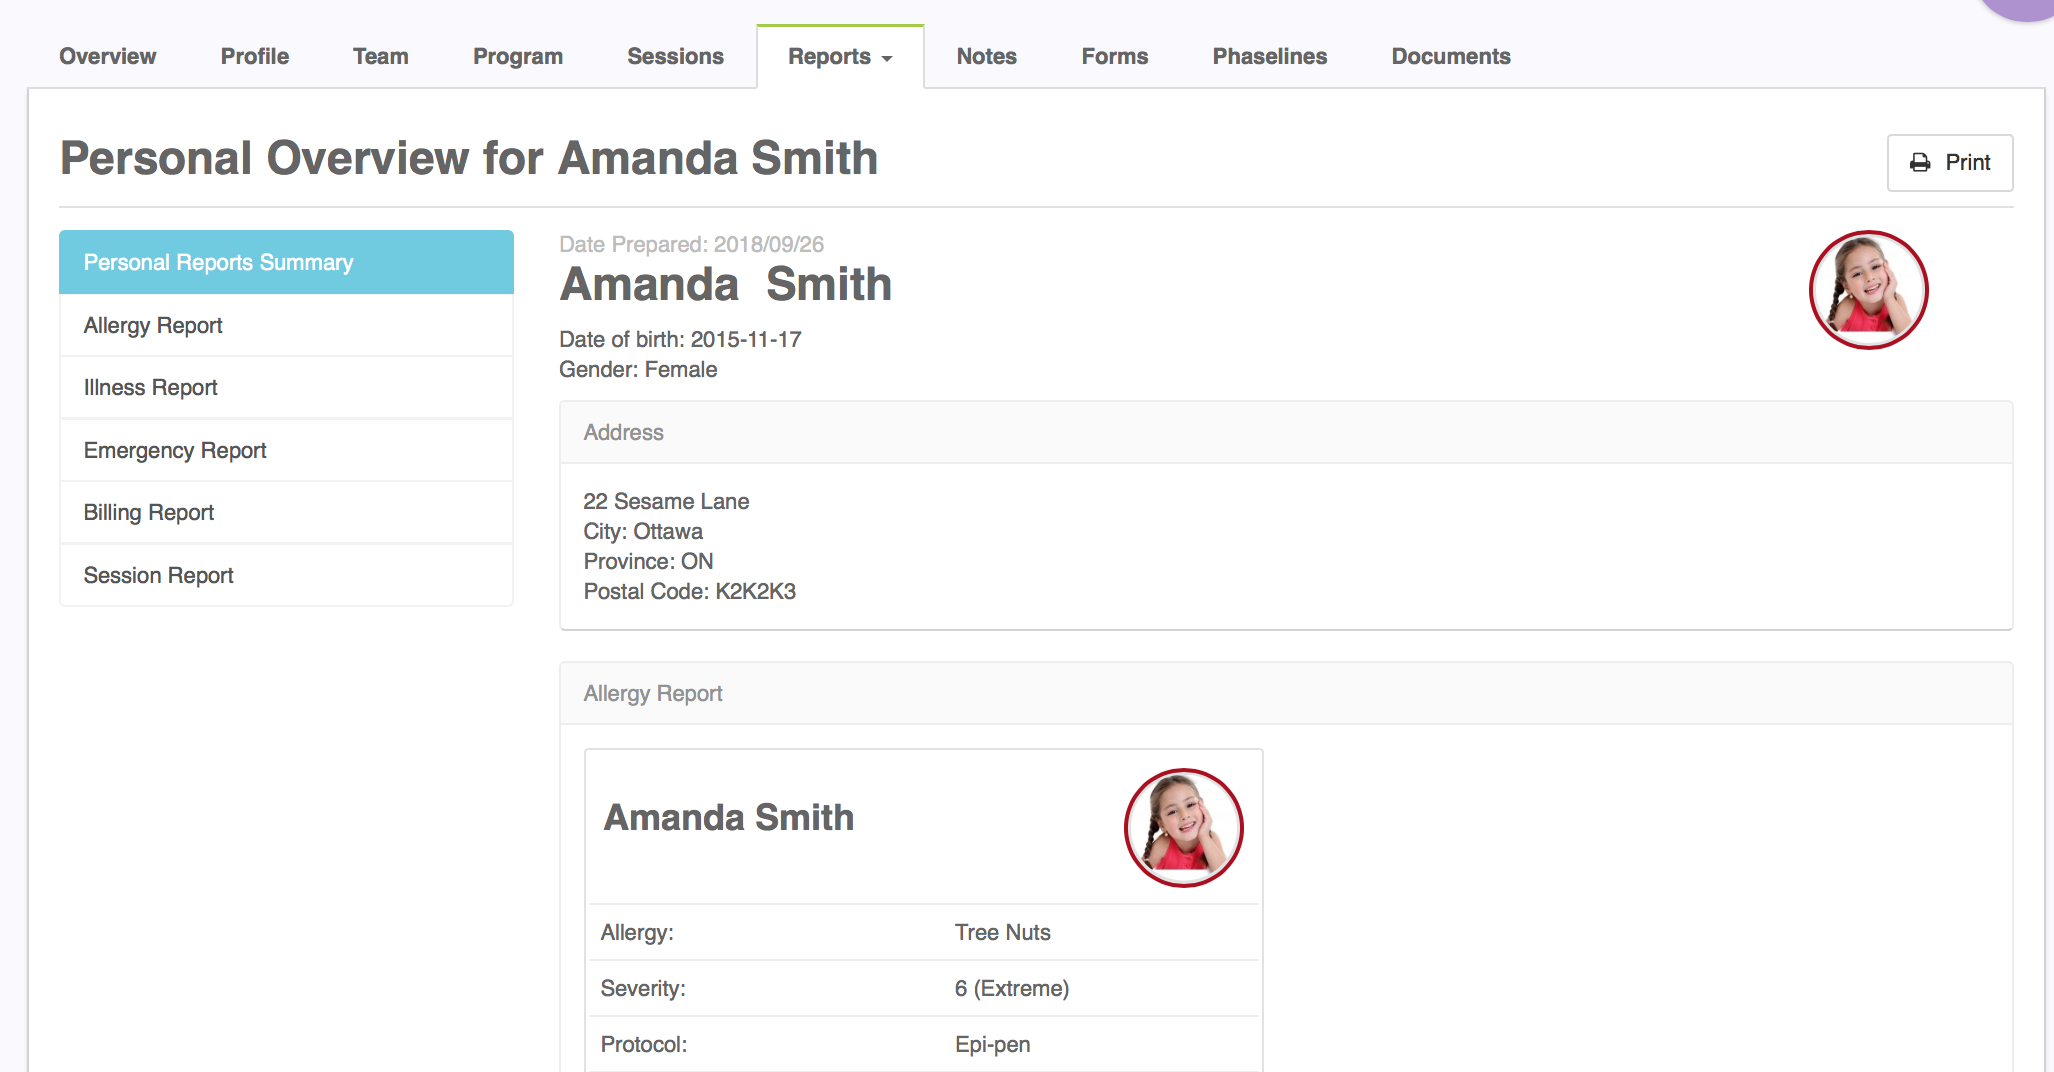
Personal Reports
This report will provide you with your Learner’s contact and important information such as illnesses, allergies and emergency contacts and a summary of personal information. Owners can also access billing information.
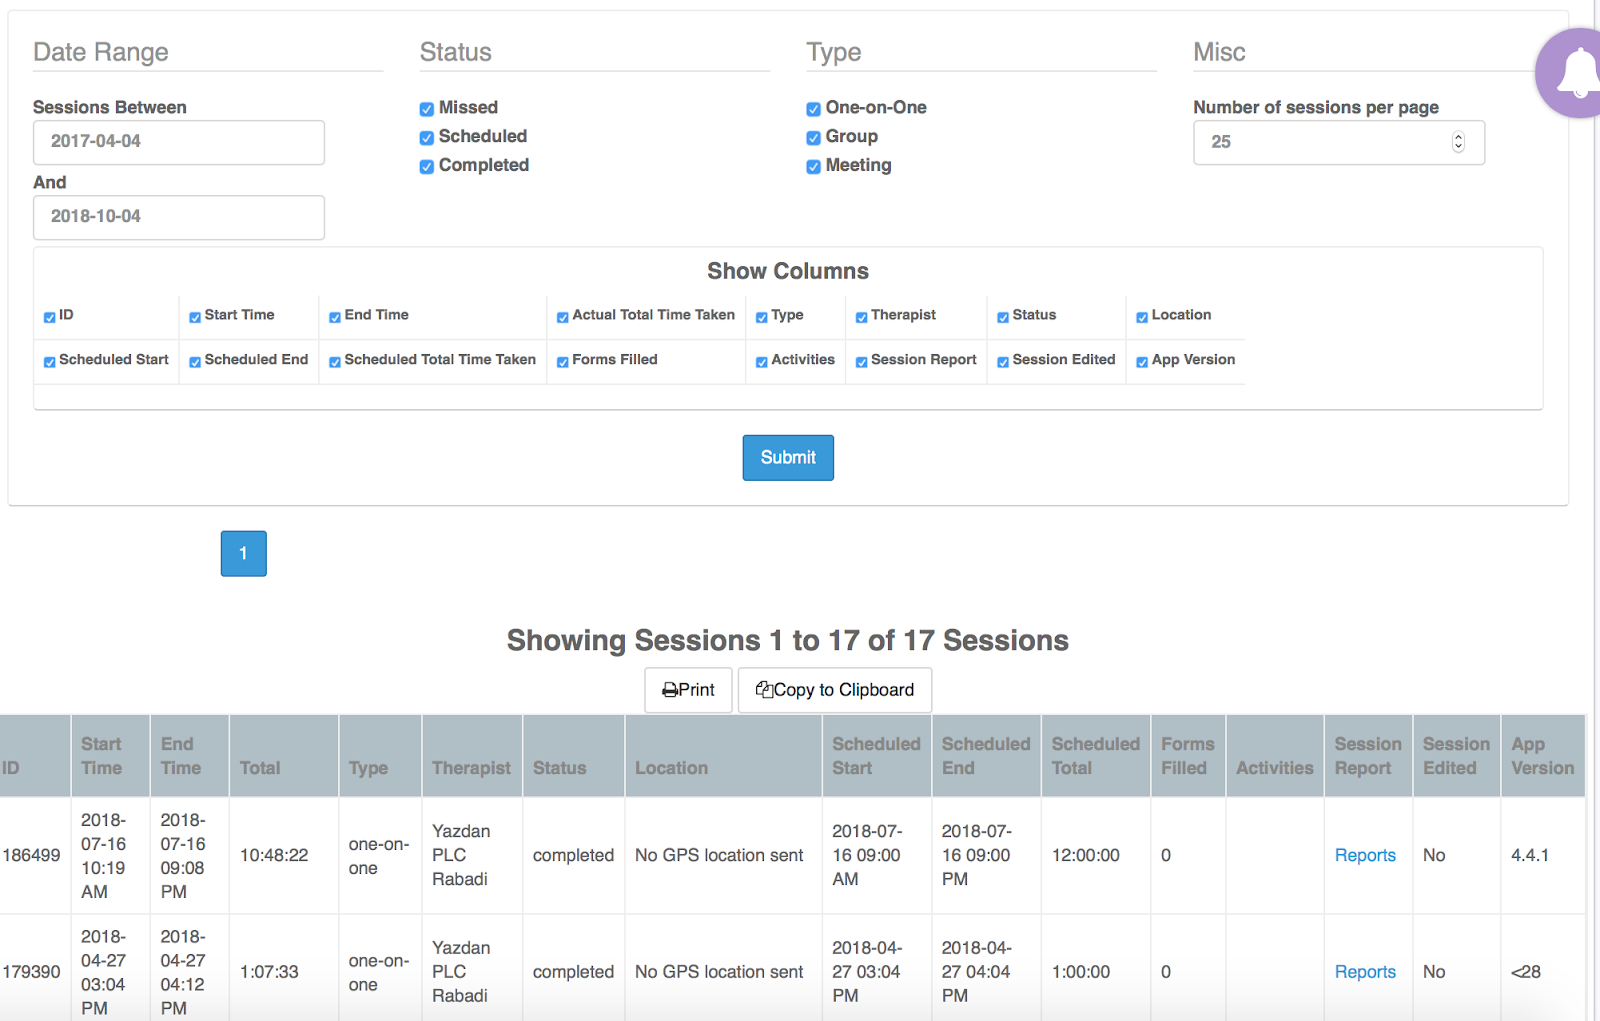
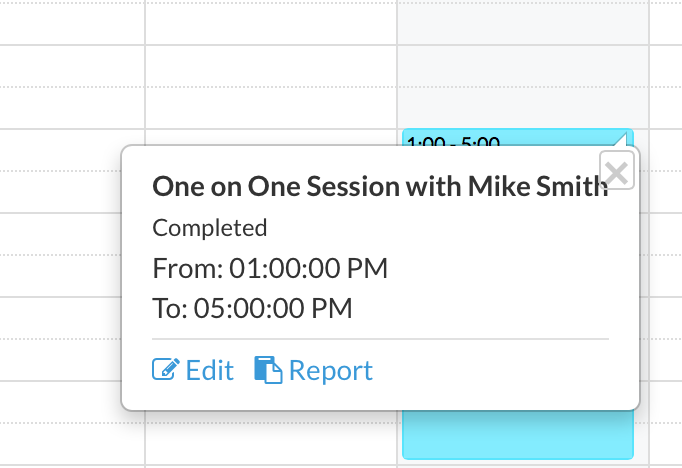
The session report is a useful tool for accessing details about every session scheduled, missed or completed in the system. The session also provides a quick link to the session report described below.
Program Reports
Here you can view a variety of different reports on all your Learner’s program data.
Program Data
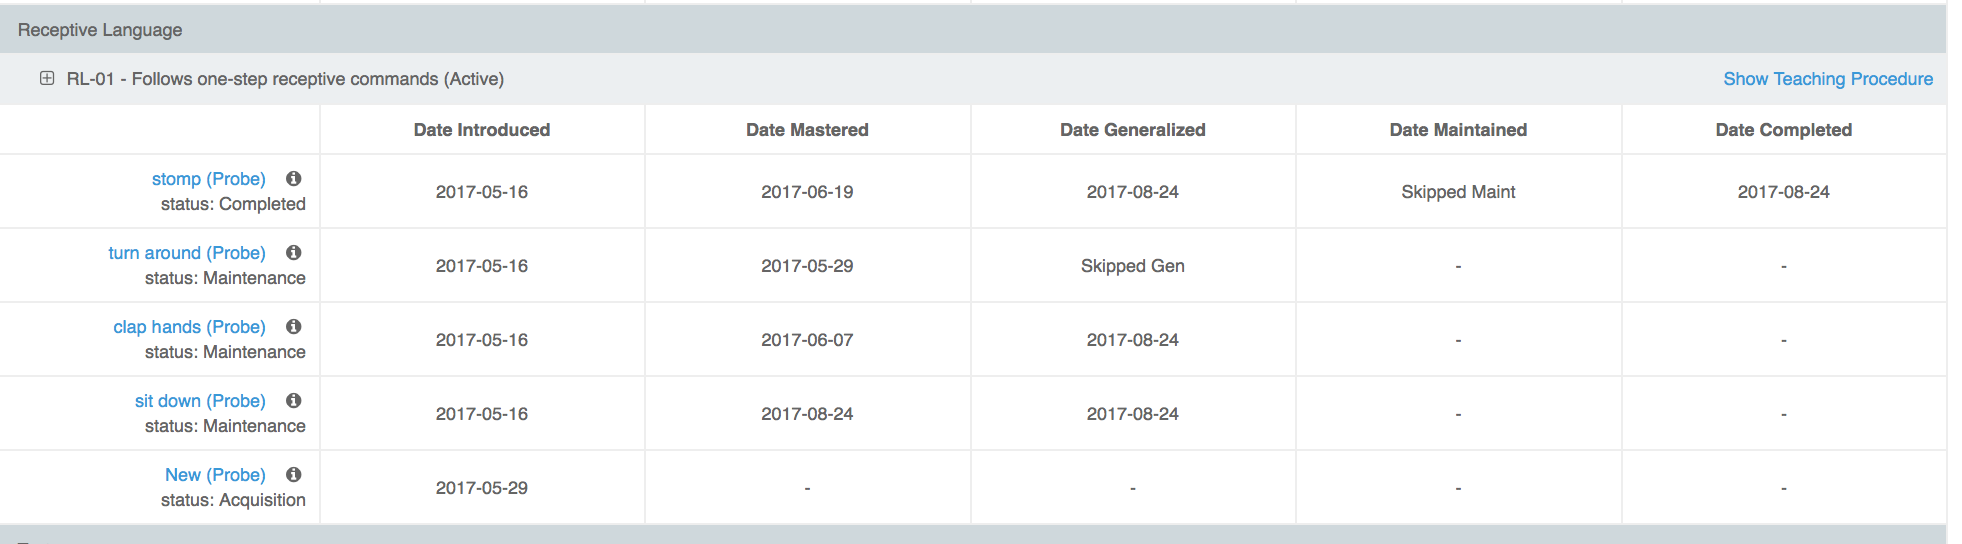
Here you can view the teaching procedures, cumulative records, individual target graphs and data as well as dates associated with the life cycle of your targets.
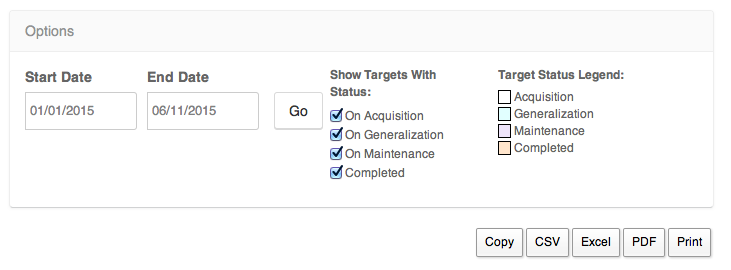
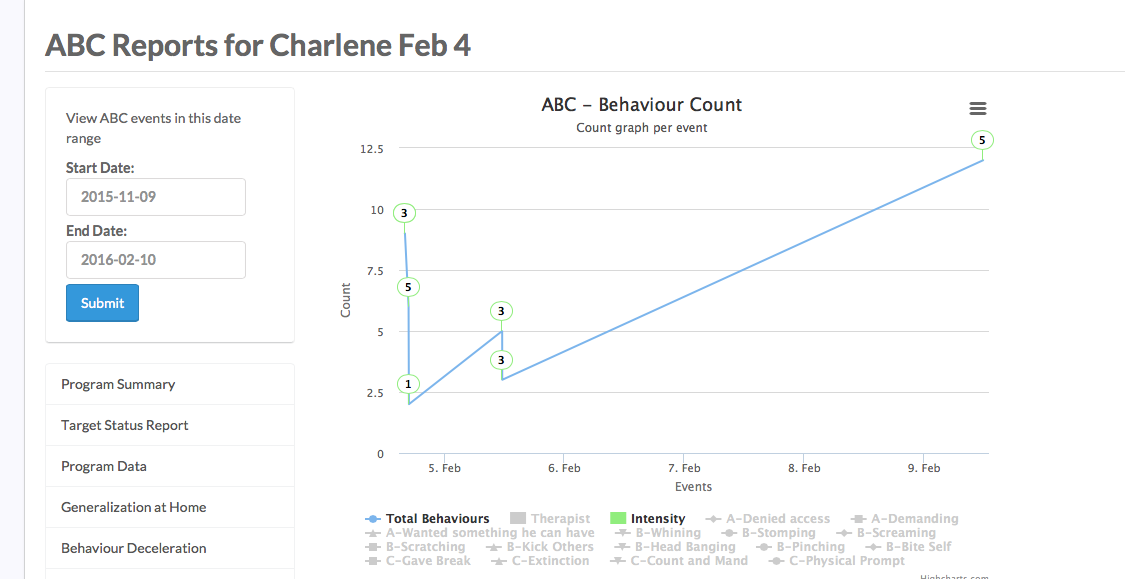
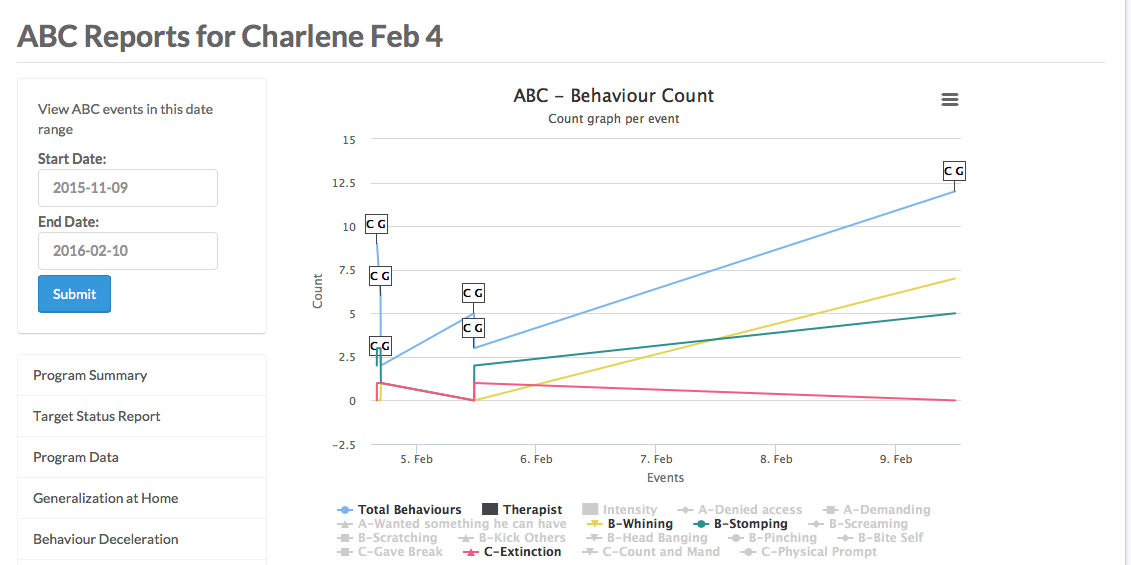
You are able to select the date range by choosing your start and end date, as well as filter results using a variety of options.
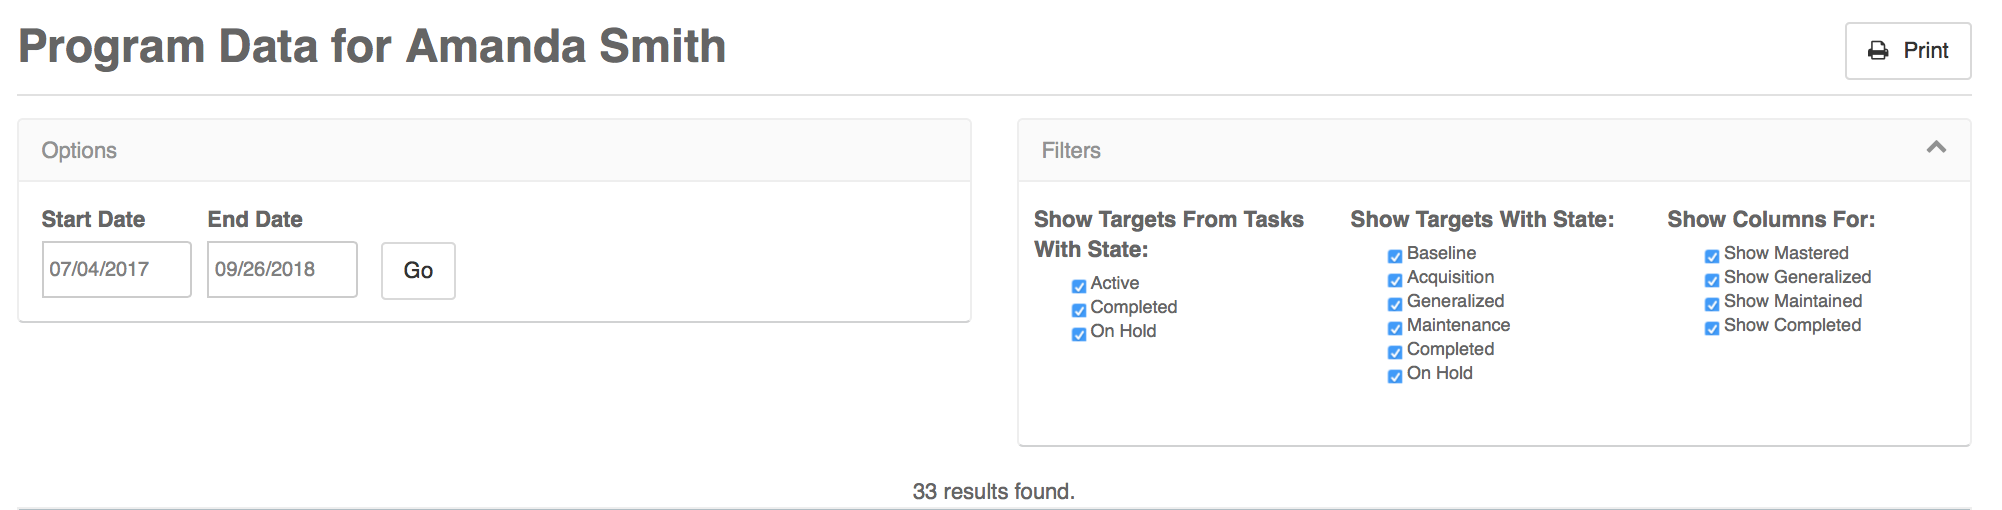
You can print this page by clicking 'Print' in the top right-hand corner of the screen.
To view the cumulative record and data for a task, select the (+) sign at the top of the task
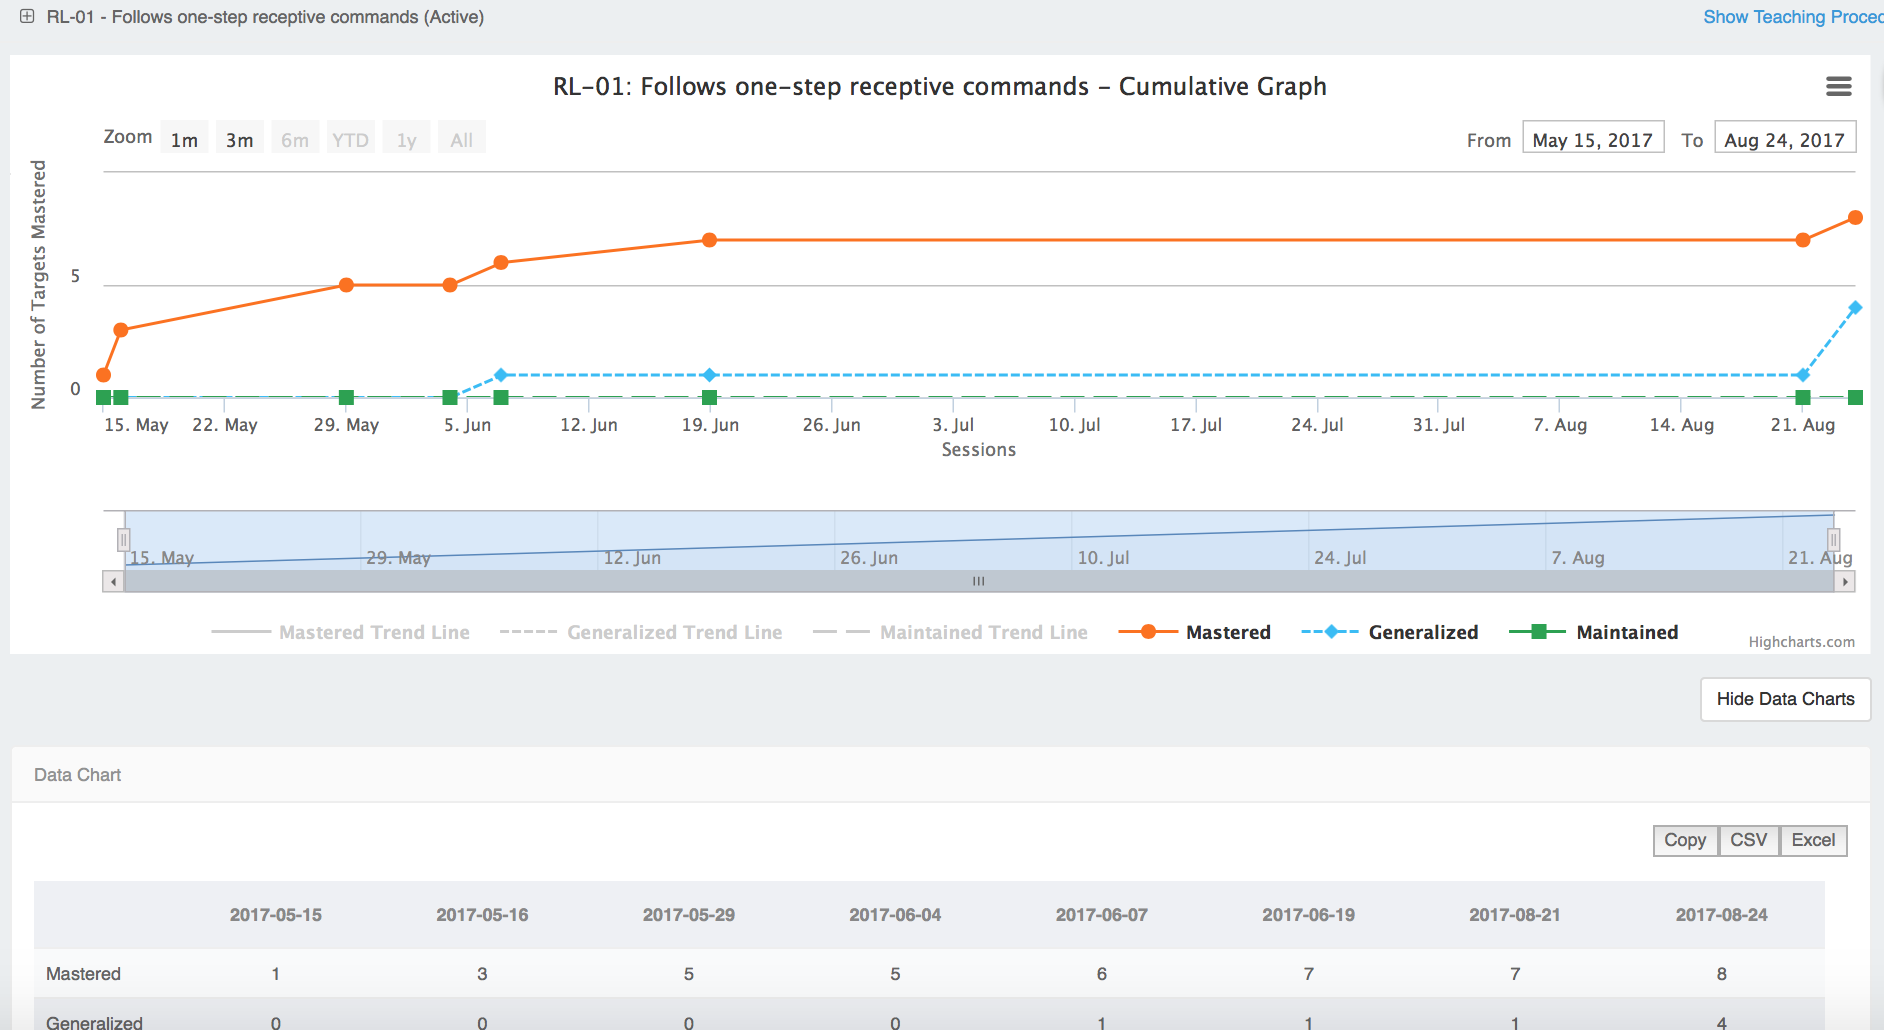
To view the graph and data for a target, select that target
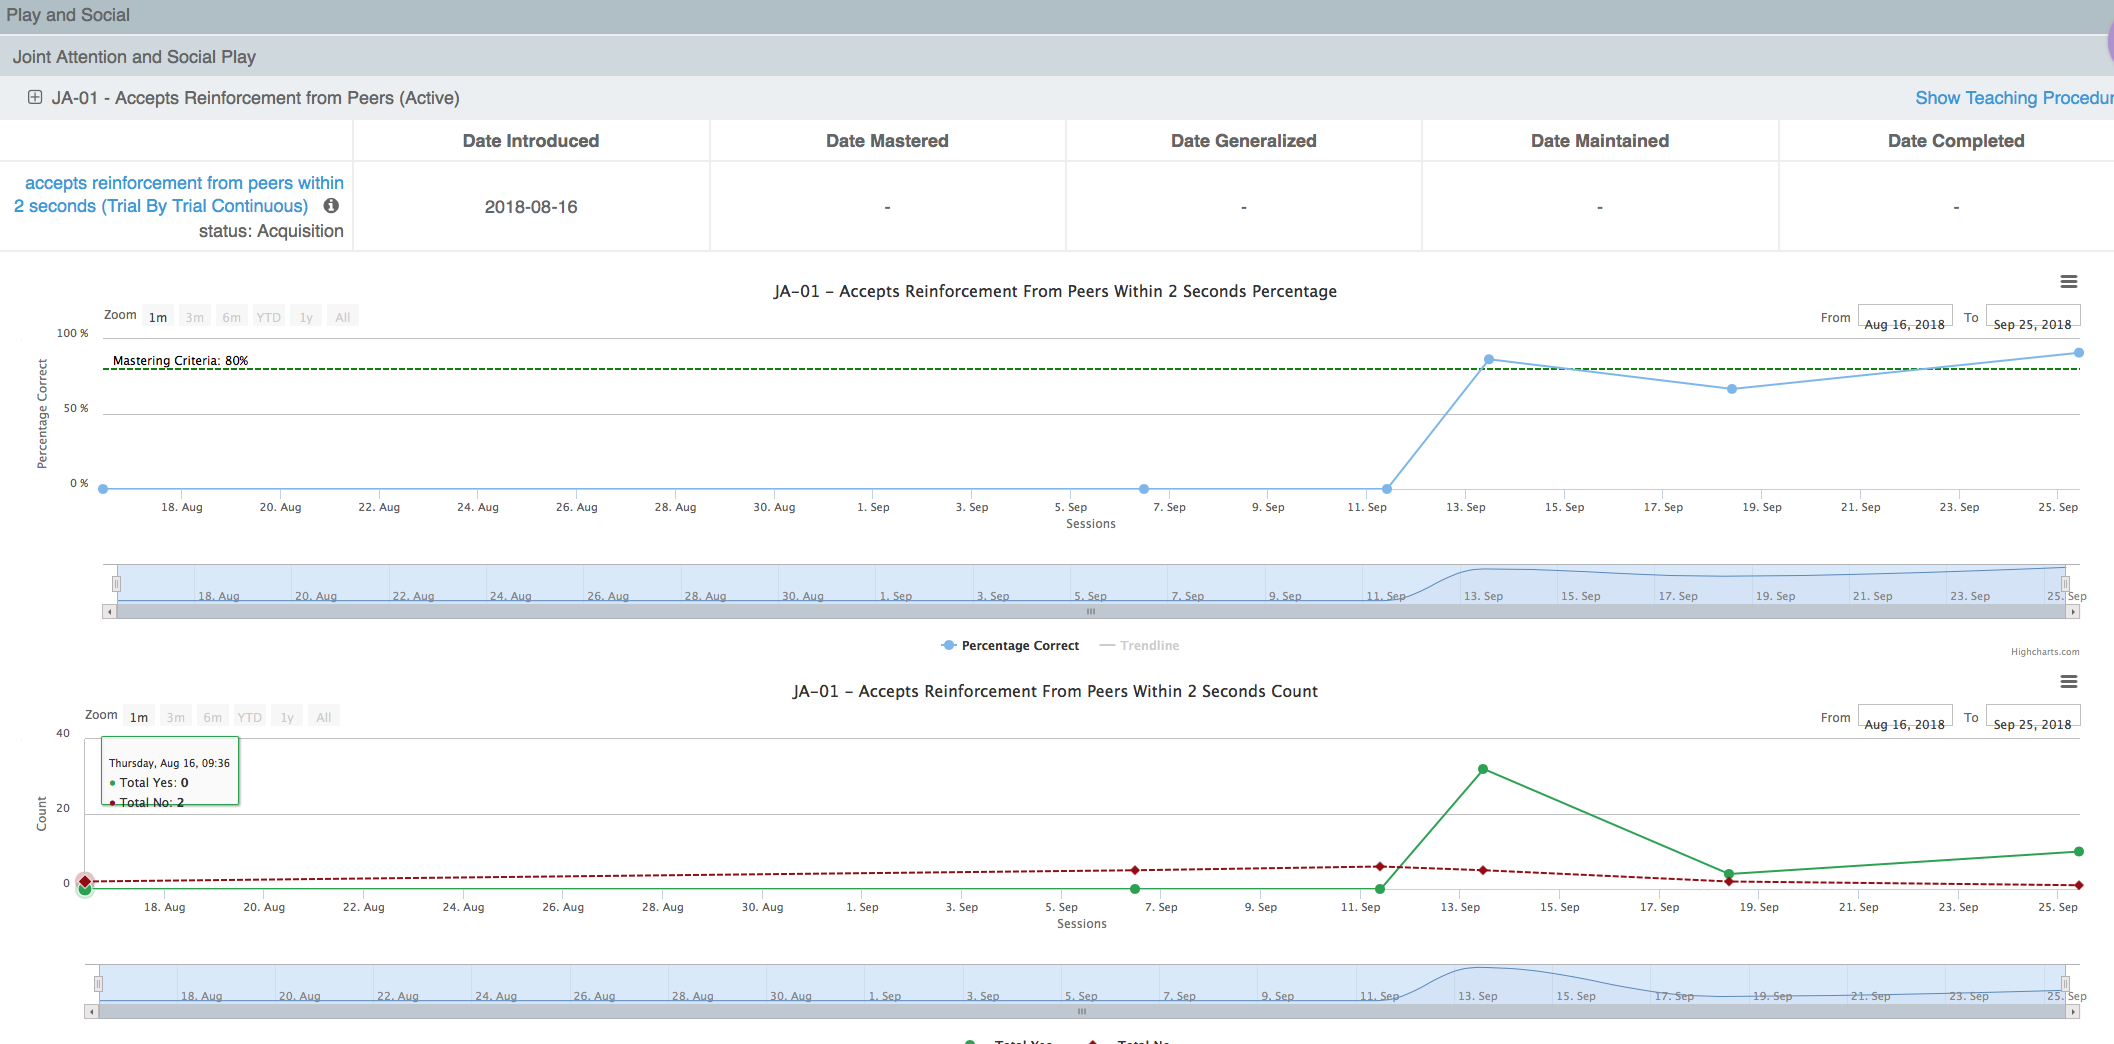
You can also print each graph and data or export to a variety of different formats (jpeg, csv, excel…etc.).
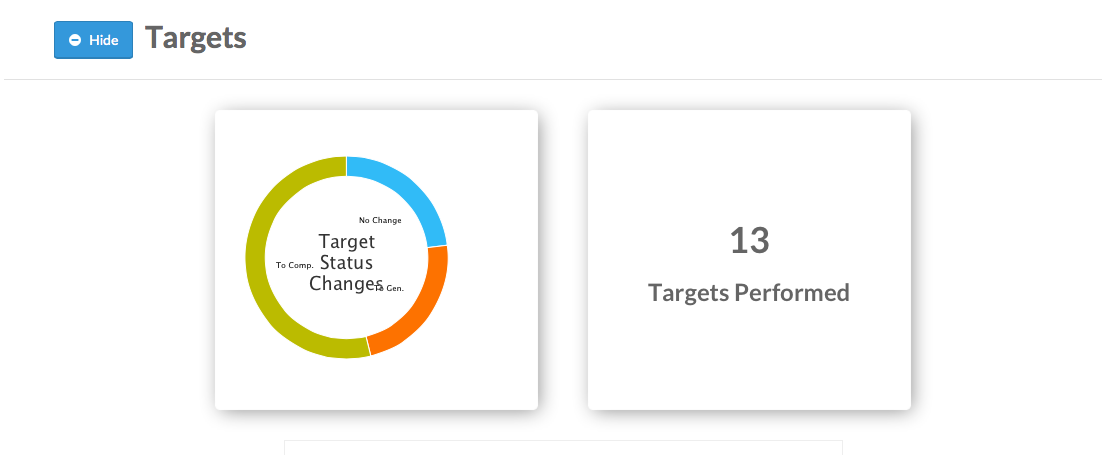
Target Status Reports
Daily data is displayed in this report.
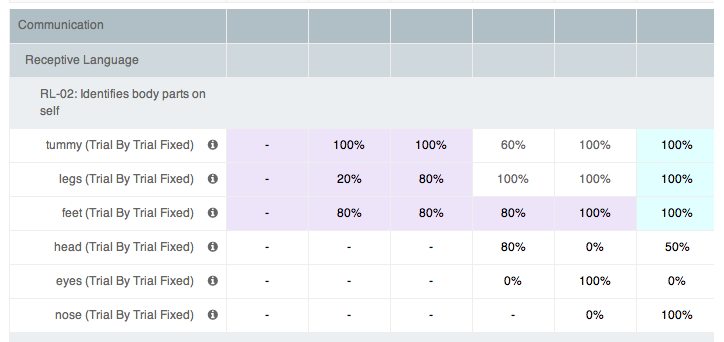
To view data for a specific time range enter in the dates or use the filters to modify the view. You can export the data by selecting 'Copy', 'CSV', 'Excel', 'PDF' or 'Print'.
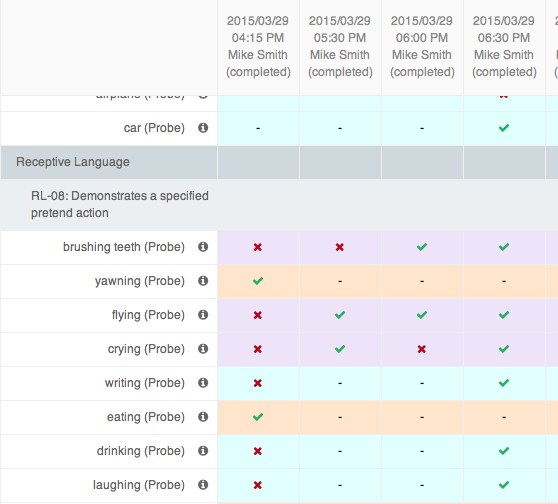
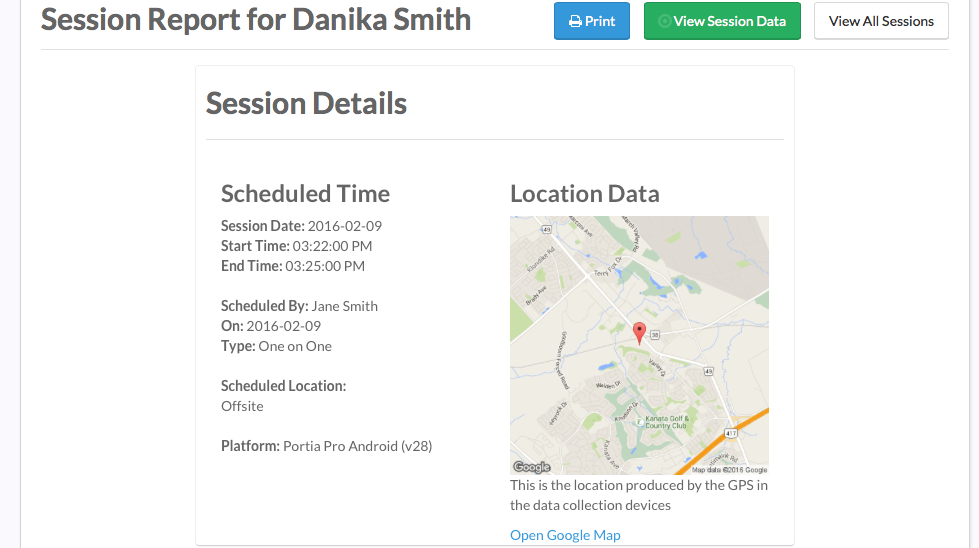
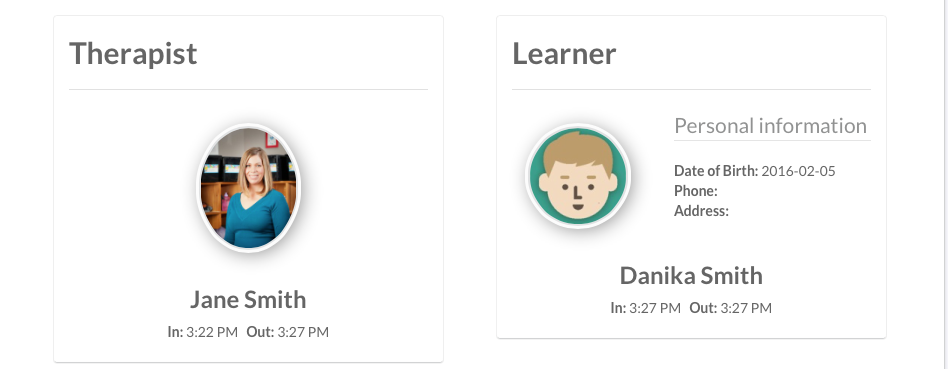
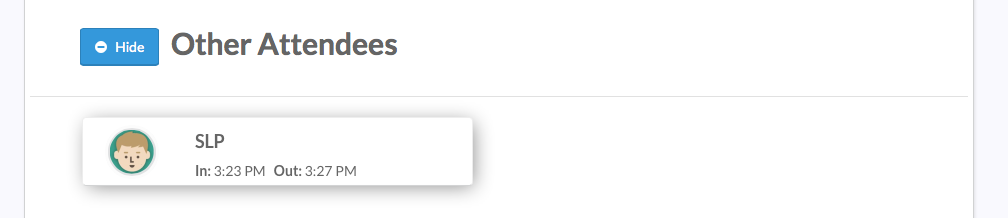
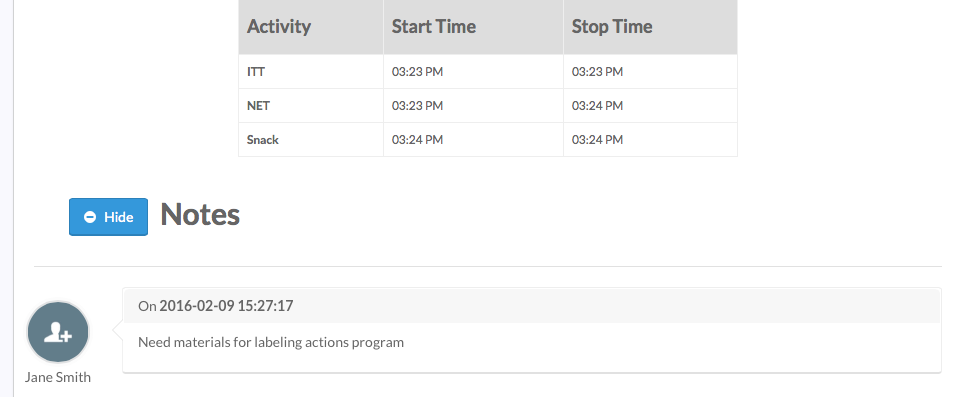
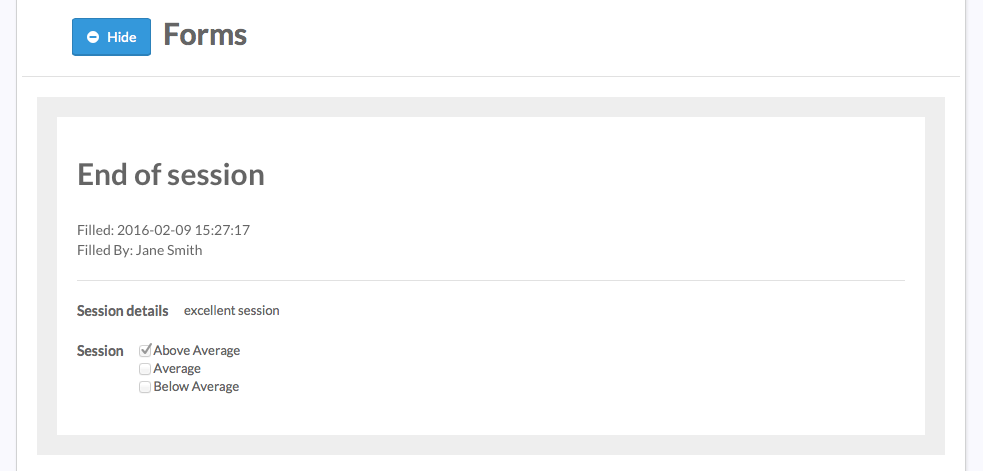
Comprehensive Session Report
This report is located on the Learner's schedule. Select the session, and click on "Report" to gain valuable in depth insight into each individual session.
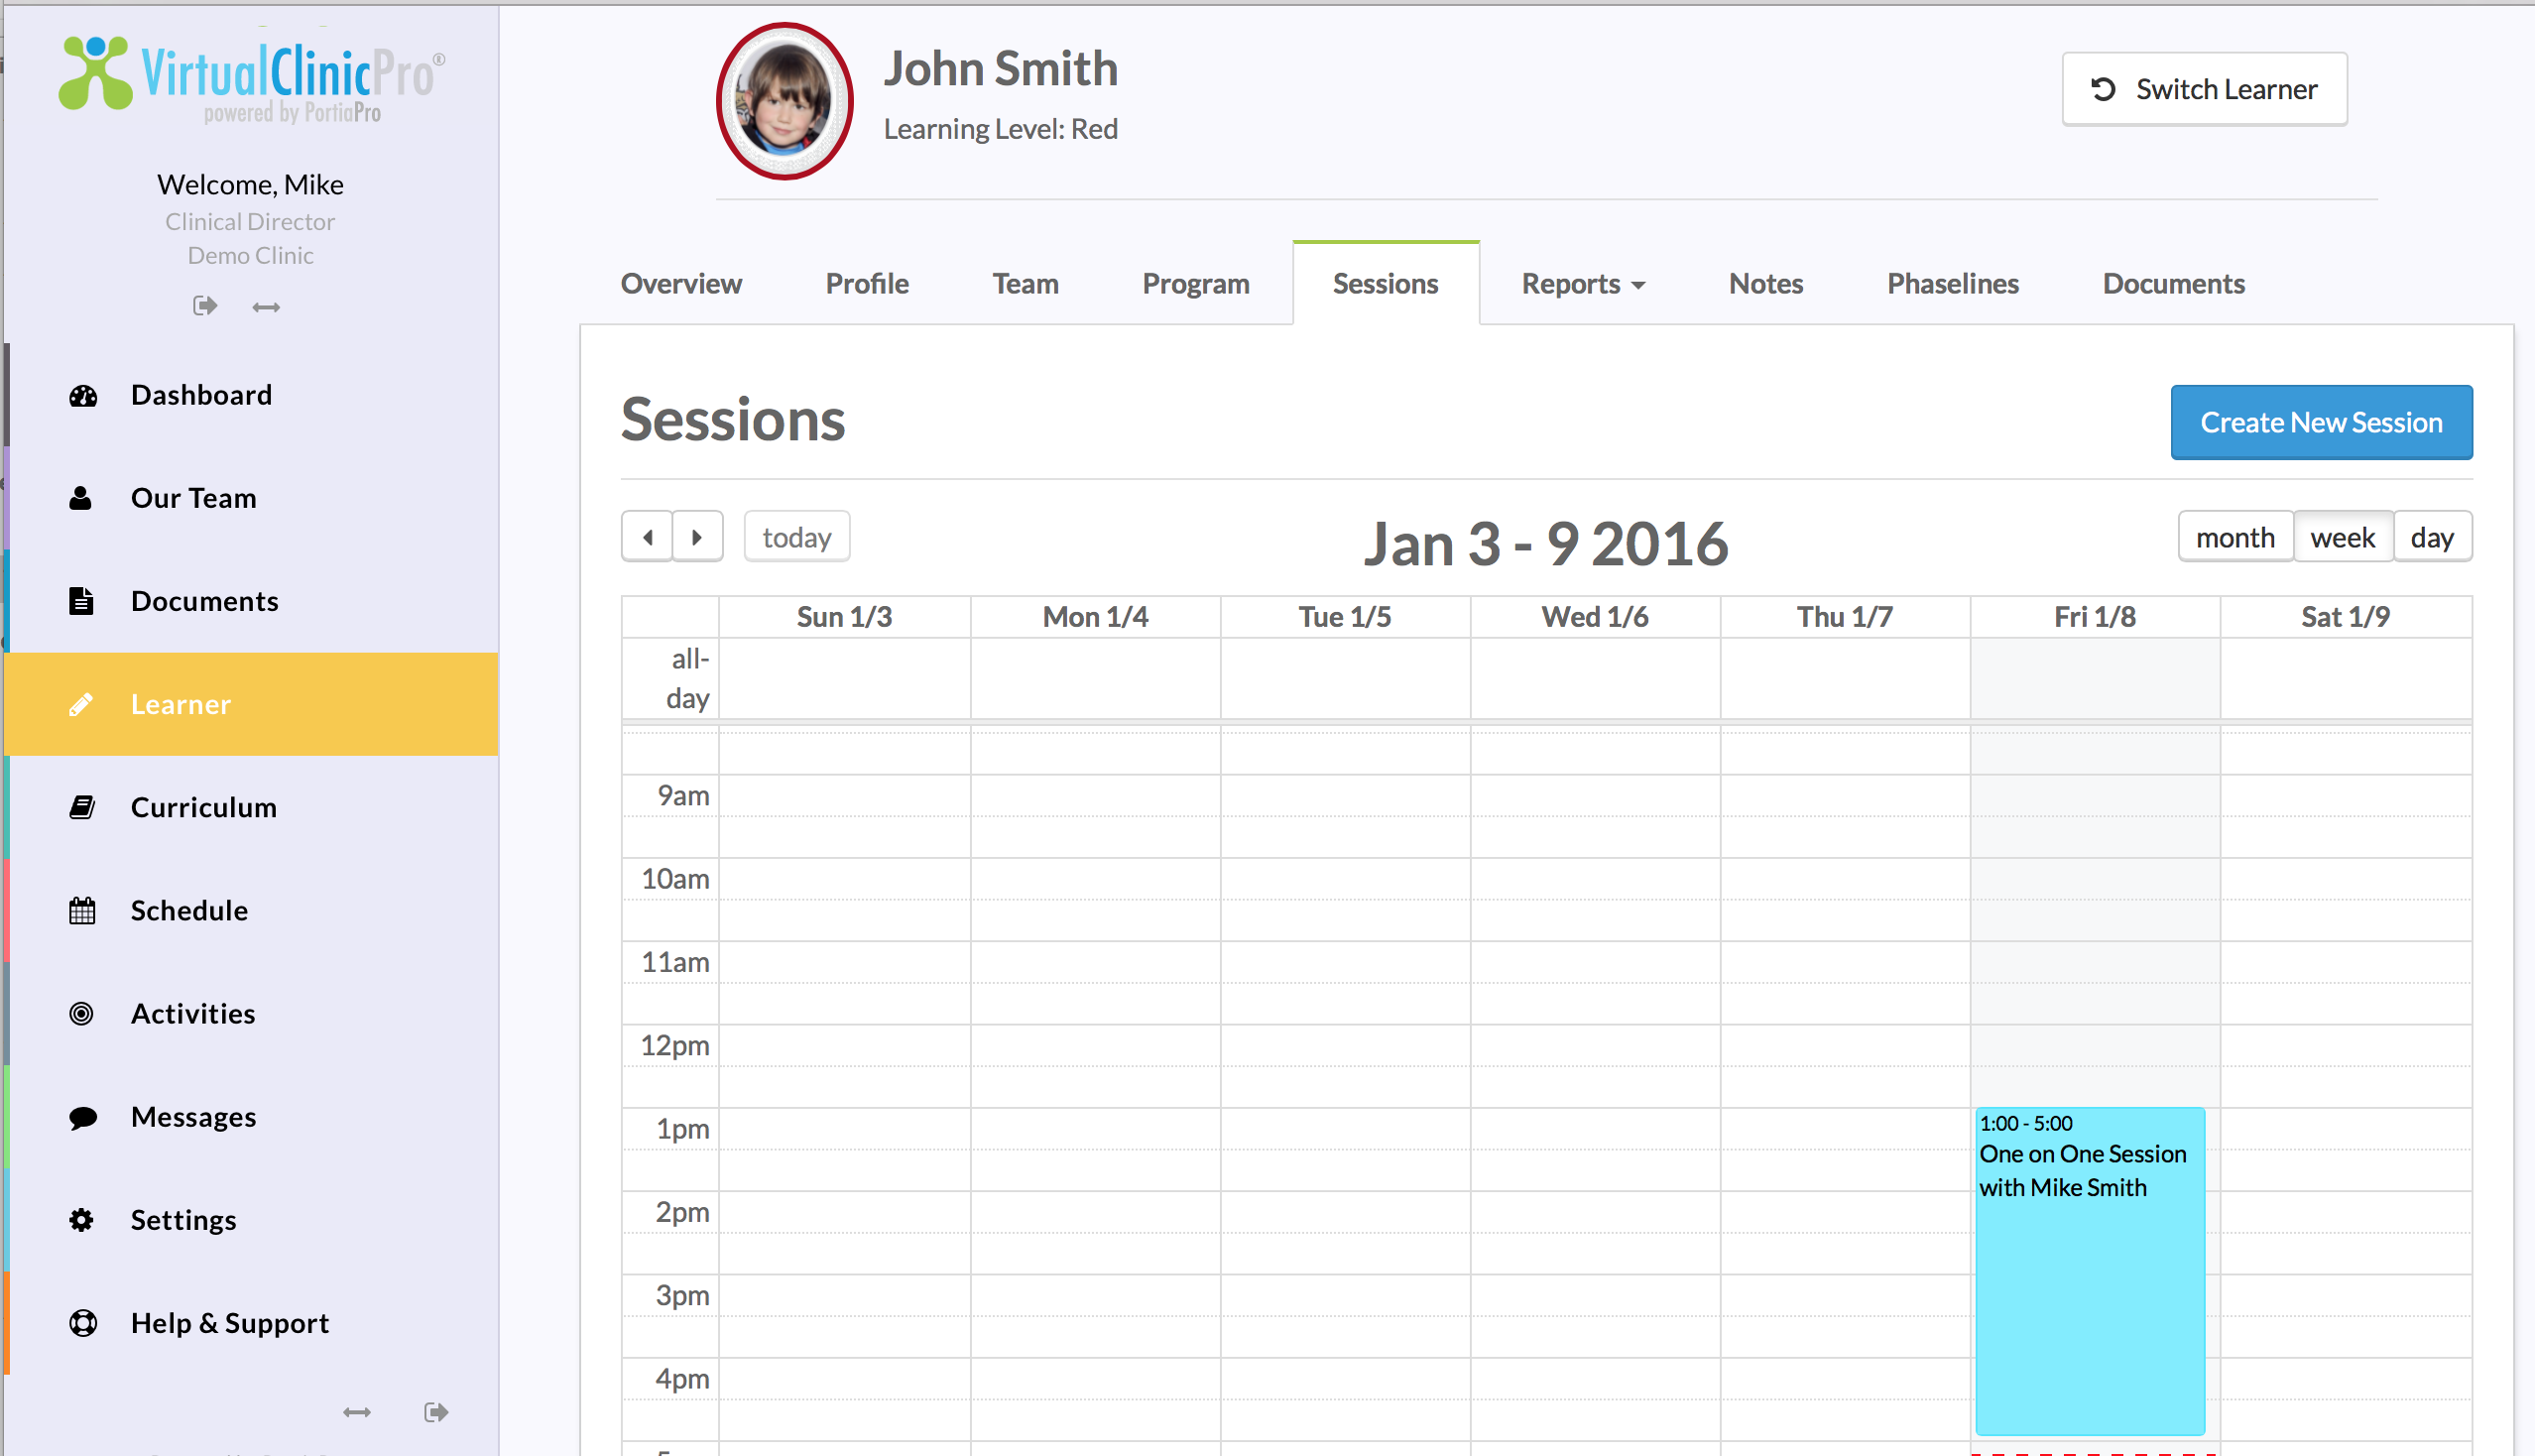
You can also find this report for the last 3 sessions on the overview page

Below are some of the items you will find on the Comprehensive Session Report.
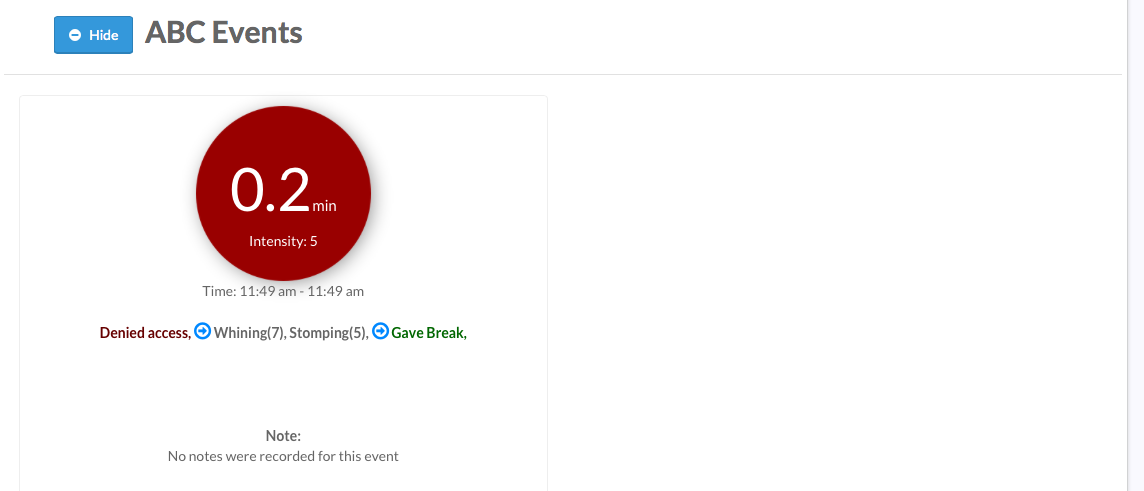
ABC Reports
In this report you can view a total frequency, events and duration of all behaviors or you can individually select which behaviors you would like to view for the selected time period. You can also select to view the antecedents, consequences, therapist and severity of the behaviour on this comprehensive graph.
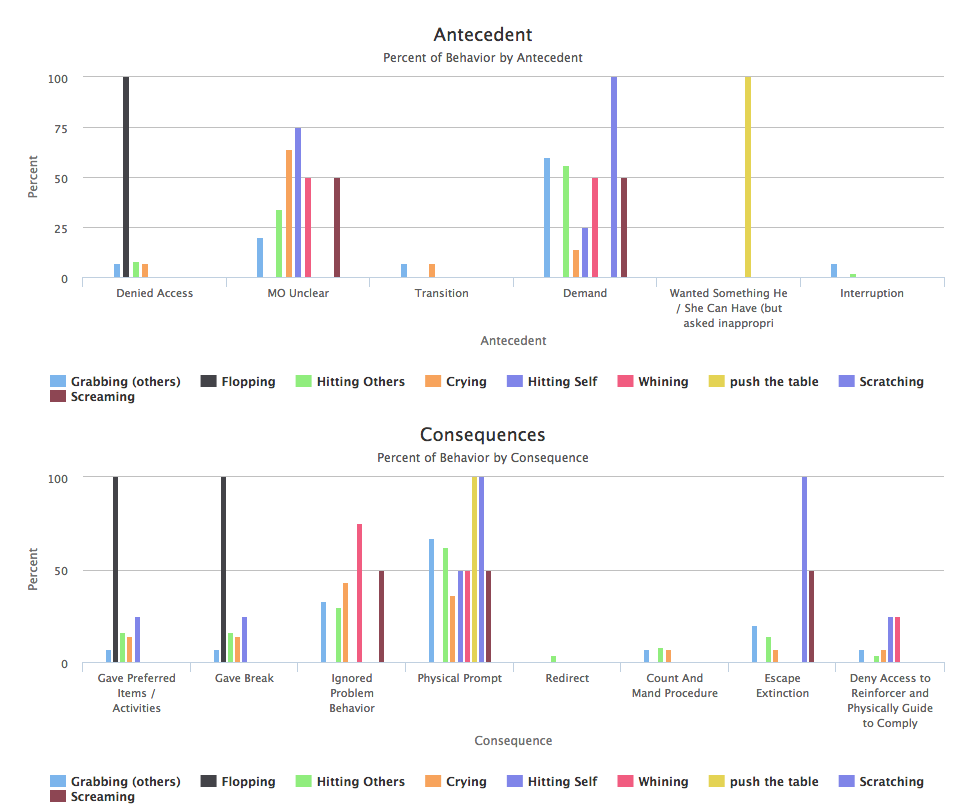
ABC Antecedent Consequence Analysis
The charts show the antecedents and consequences at the bottom and each bar represents the percent of occurrences of the behaviour that resulted from the antecedent or consequence.
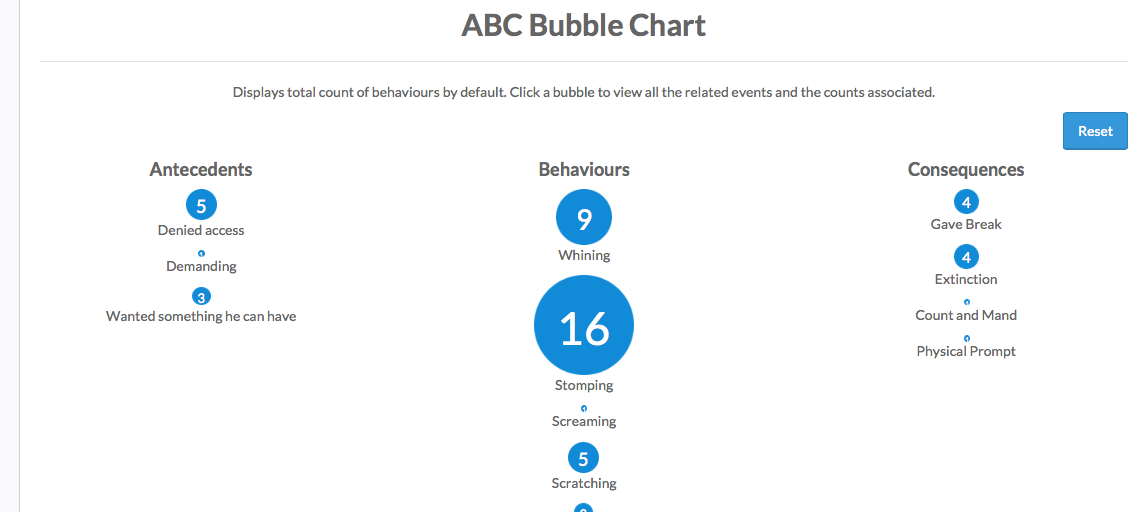
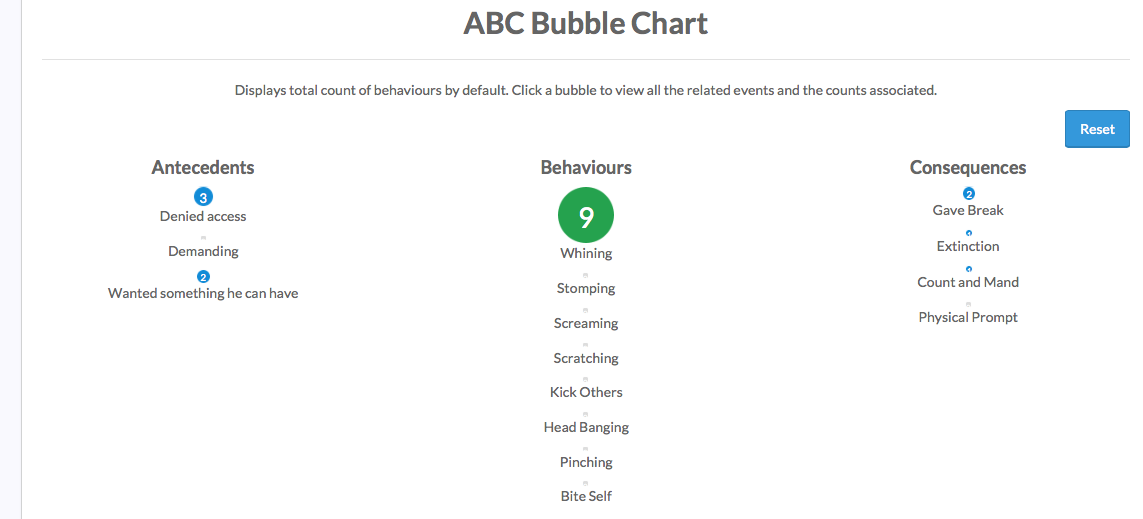
Additionally, you can use the bubbles to view antecedents, behaviours, and consequences for each event and see how they are related for functional analysis.
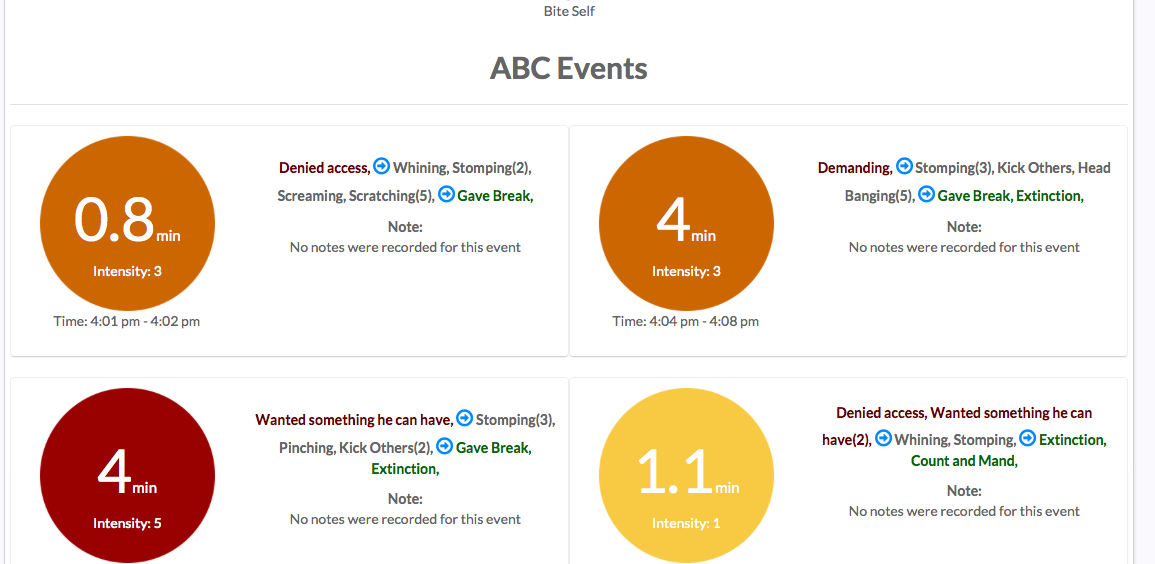
Finally, you can view each behavior event that occurred within the time period to analyze each event in detail.
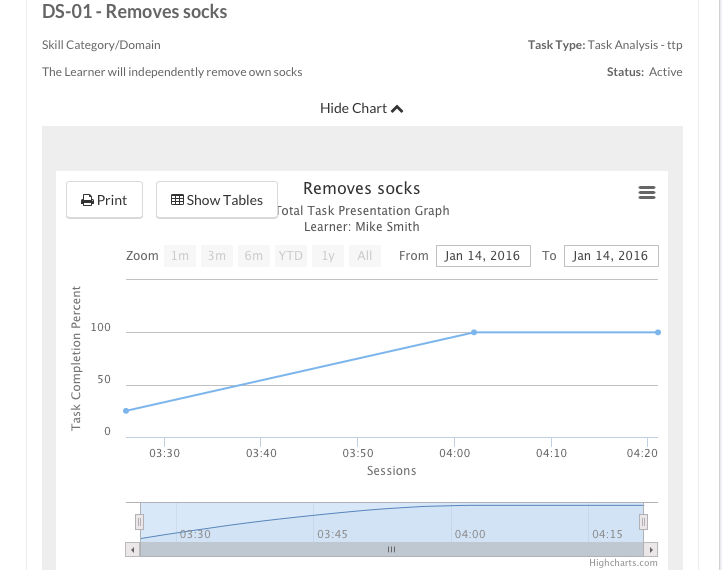
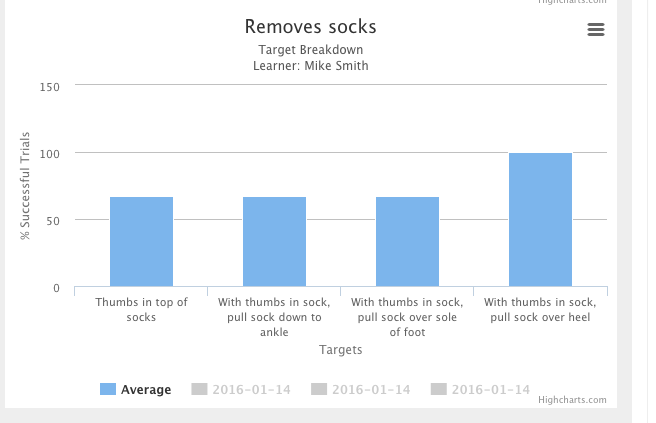
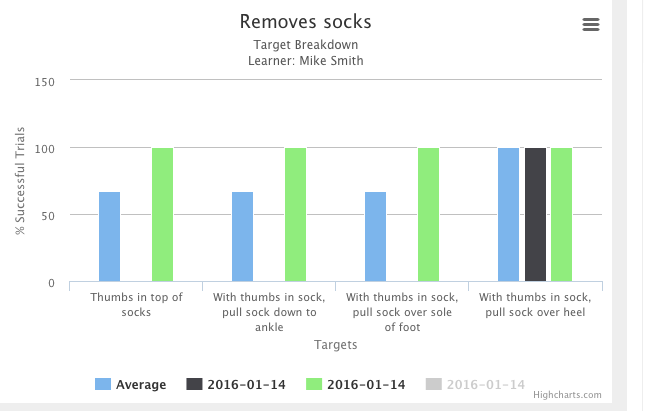
Task Analysis Report
All your task analysis tasks will have a separate report where you can easily view the total task percentage as well as a bar graph of progress for each individual target.
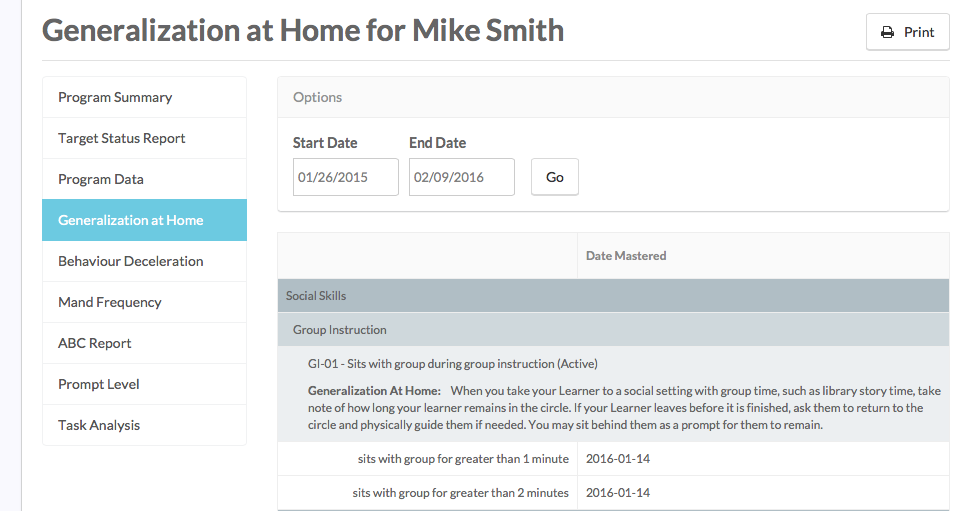
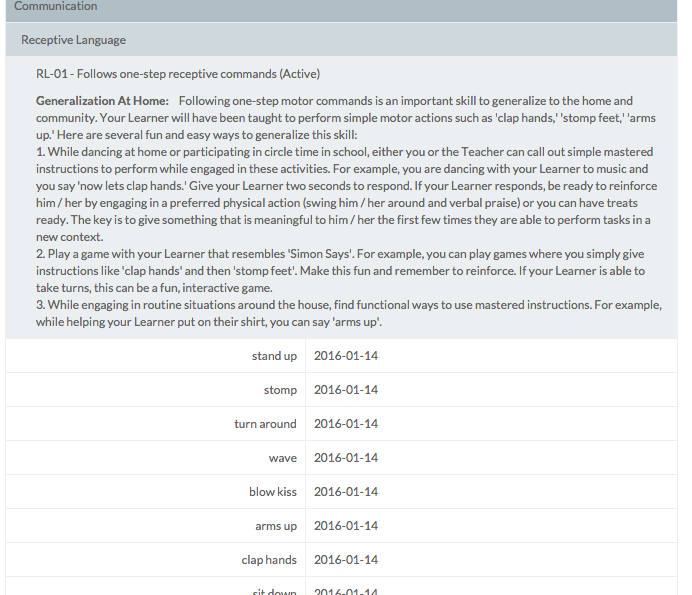
Generalization at home
This report lists suggested generalization procedures for each program and the targets mastered within each program for the selected time period. The report can be saved as a PDF or printed to be sent home to caregivers.
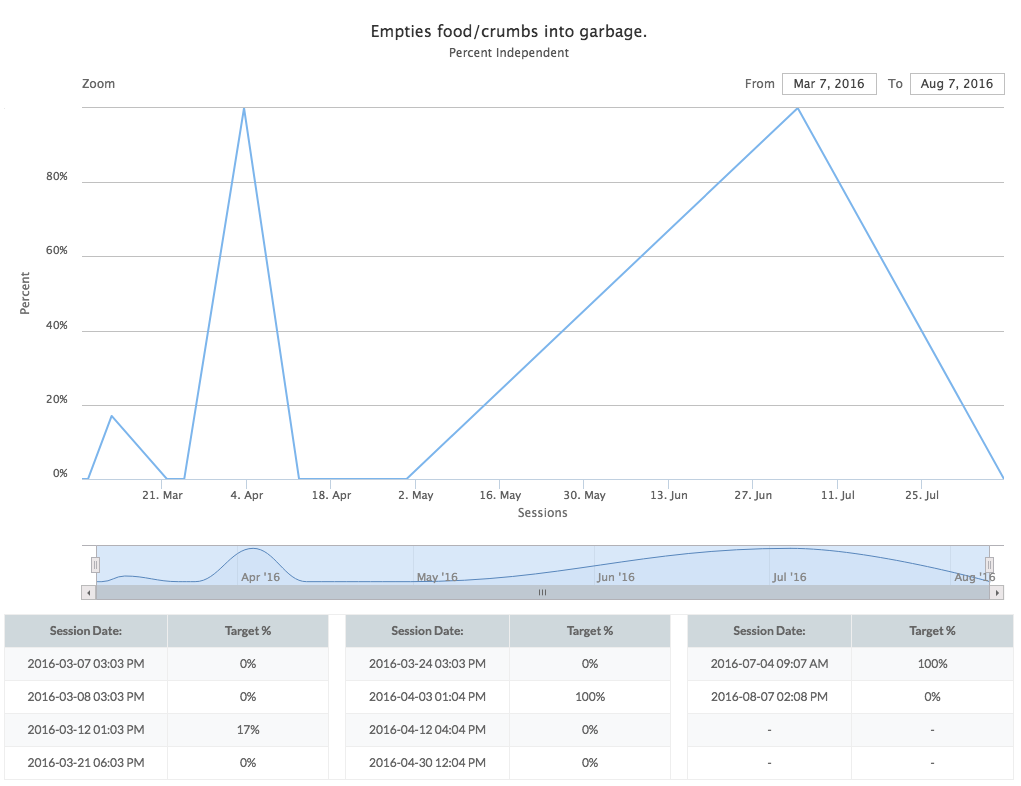
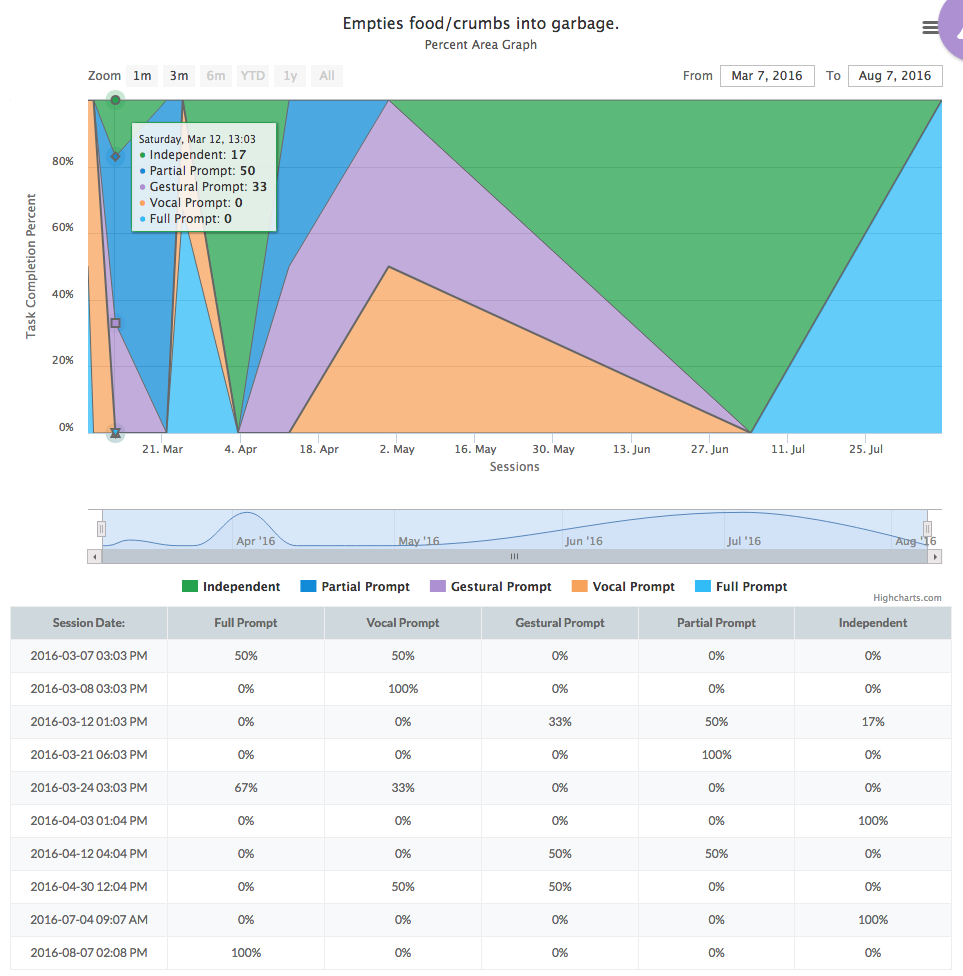
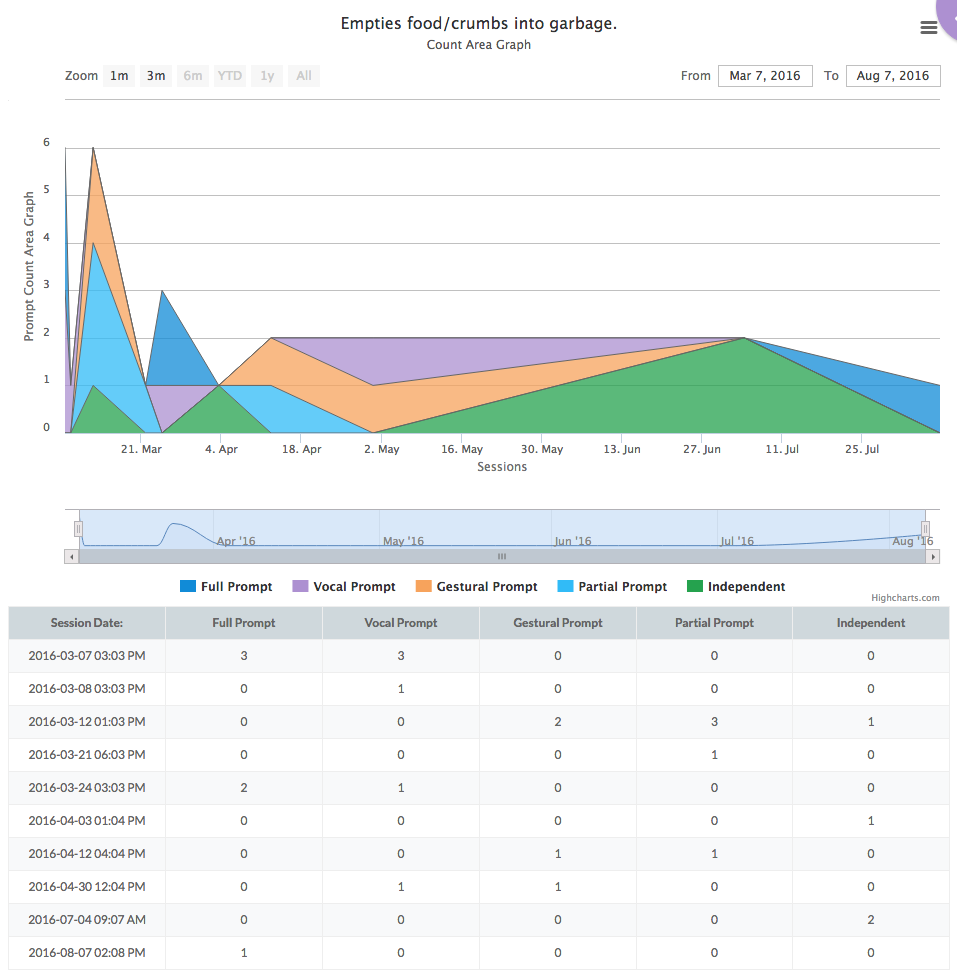
Prompt Target Report
This report lets you select a specific target and view your data in an incredible amount of detail.
We’ve made 4 different graphs that, while similar, give you very different views on your data.
This report allows you to select a specific target (of type Trial by Trial with Prompt), and view 4 graphs for the target data.
Percent Line Graph
This graph shows the percent of trials that had an “Independent” response
Percent Area Graph
This graph shows the percent of each response as a stacked area. This allows you to quickly visualize responses and their changes over time. Note that if you deselect all the prompt levels except for “Independant”, you will end up with the percent correct line graph.
Count Area Graph
This graph shows the count of each response as a stacked area.
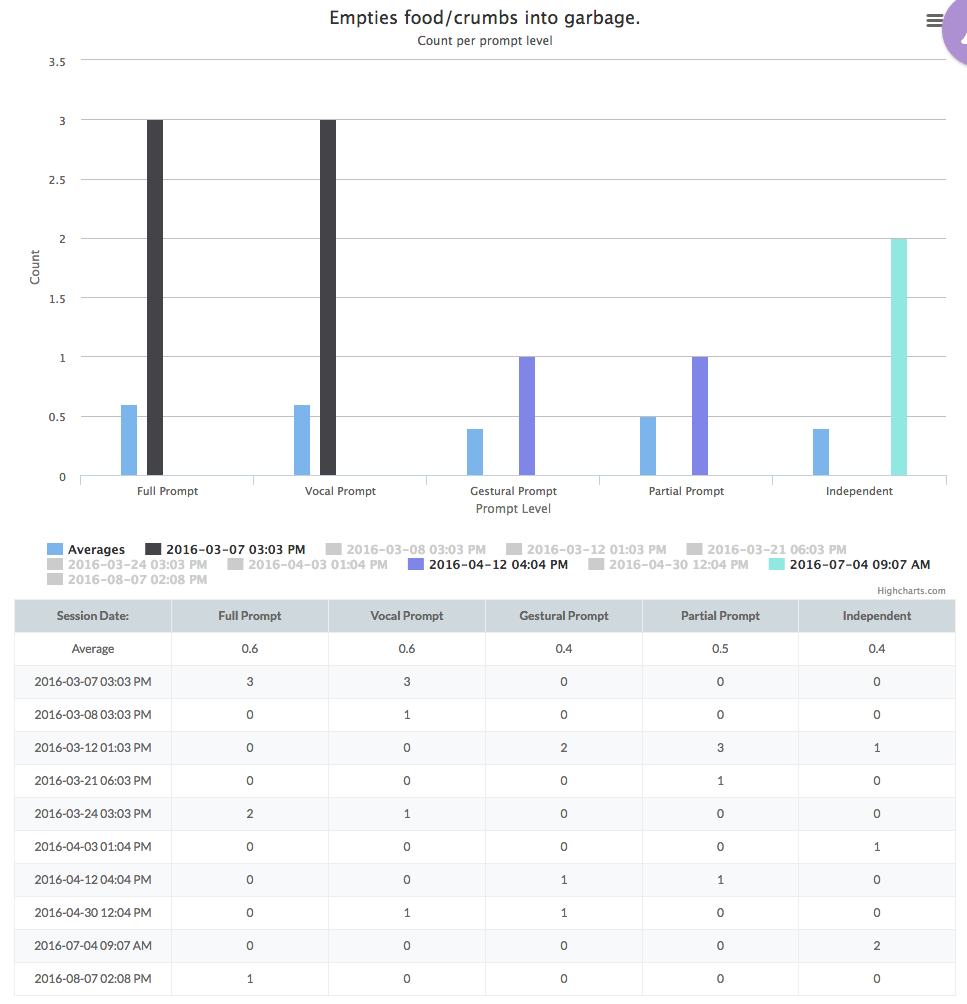
Count Per Session Bar Graph
This allows you to visualize the count of each prompt as an average across all sessions or by individual sessions
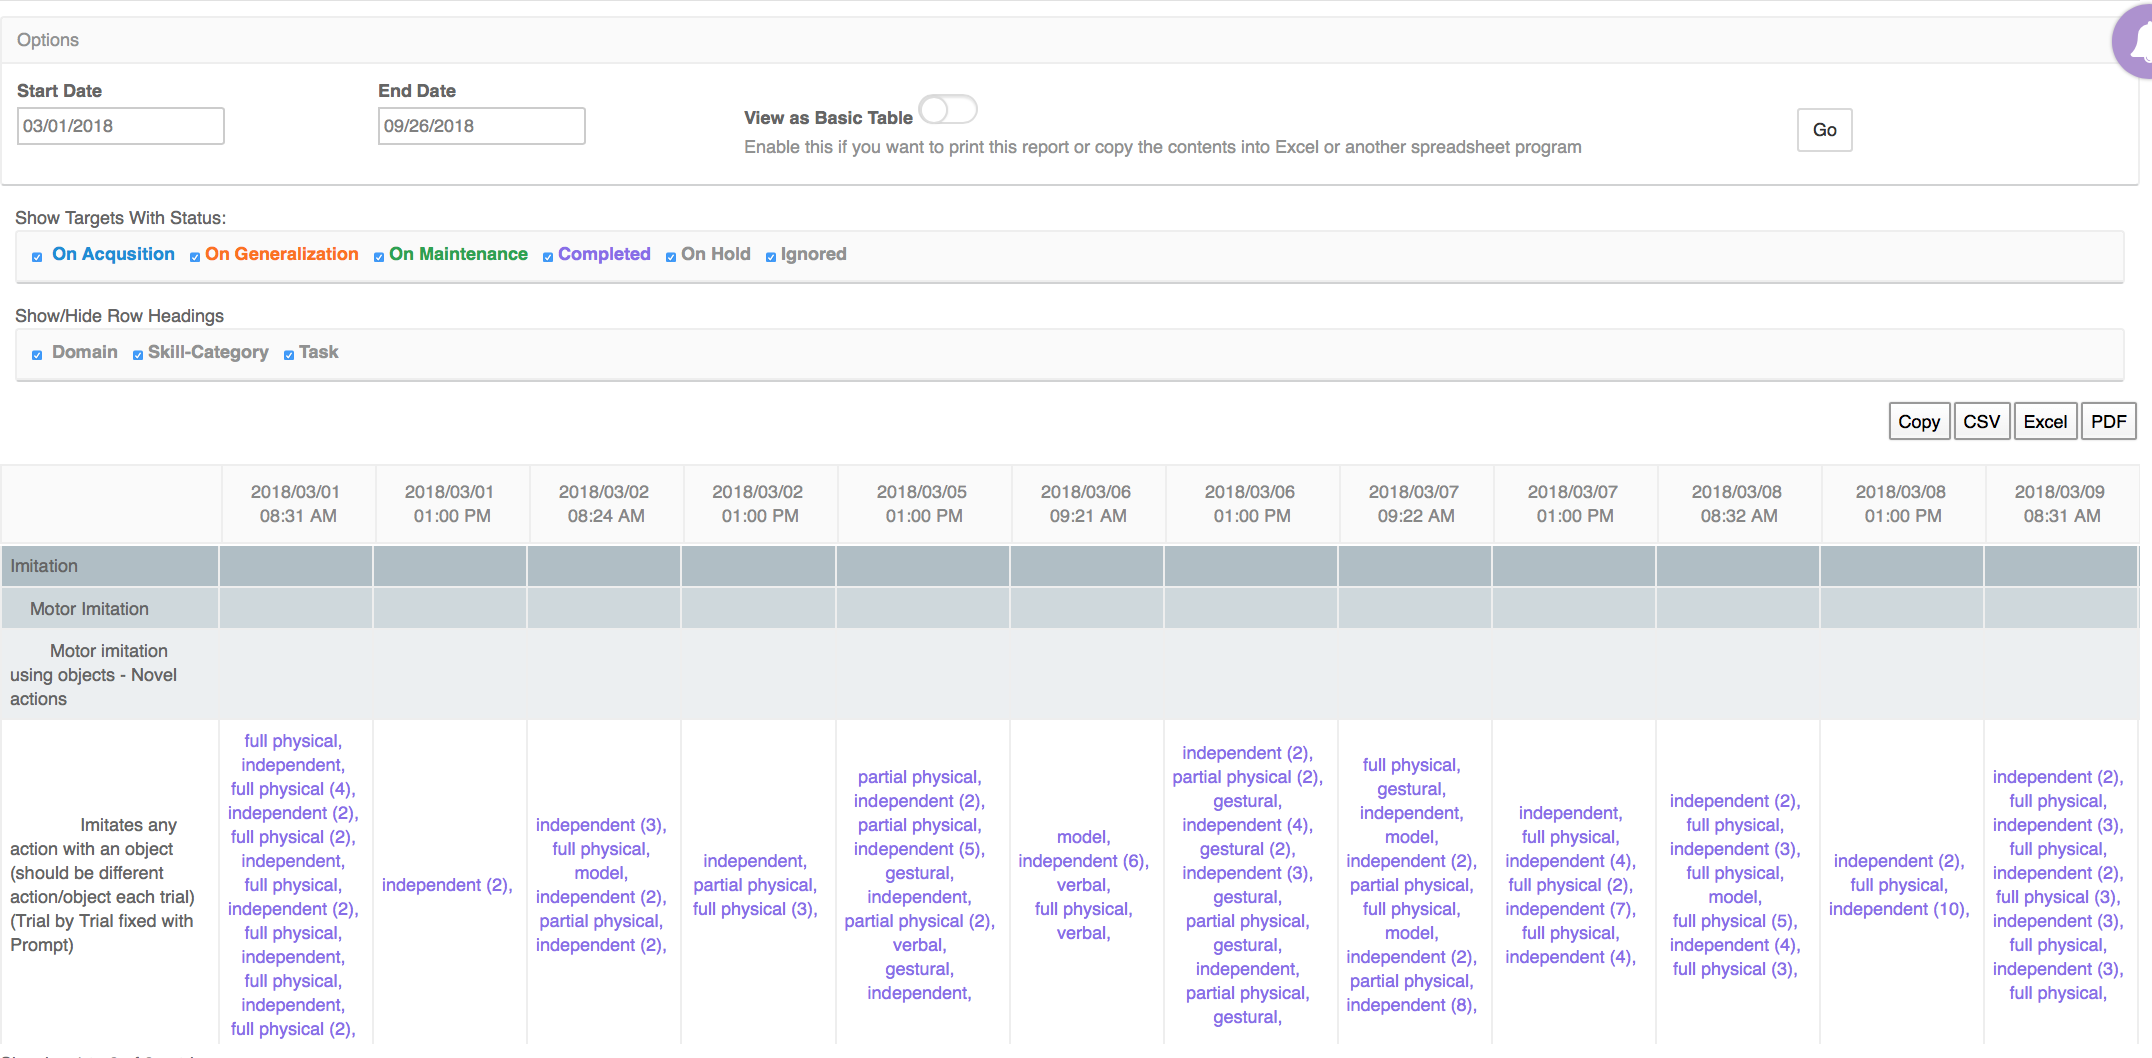
Prompt Level Summary
This report allows you to see the data, in order, for every prompt issued for every target each session. You can filter by date, show and hide headings and filter by life cycle. Additionally, you can print the report or copy the table to excel.
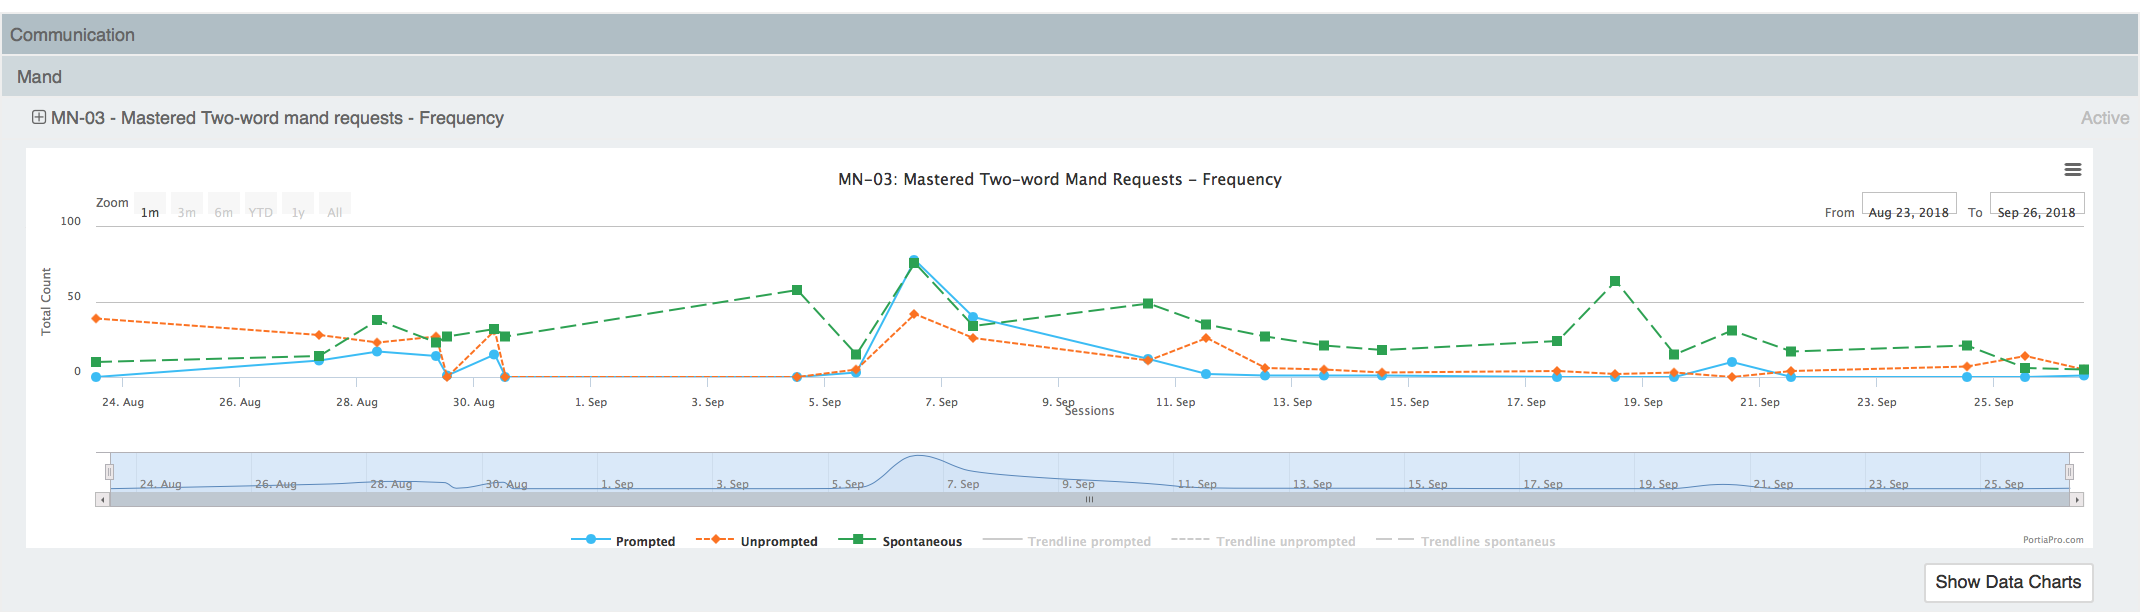
Mand Frequency
This report allows you to view tasks that are set as mand frequency. The graph displays prompted, unprompted and spontaneous data and trend lines.
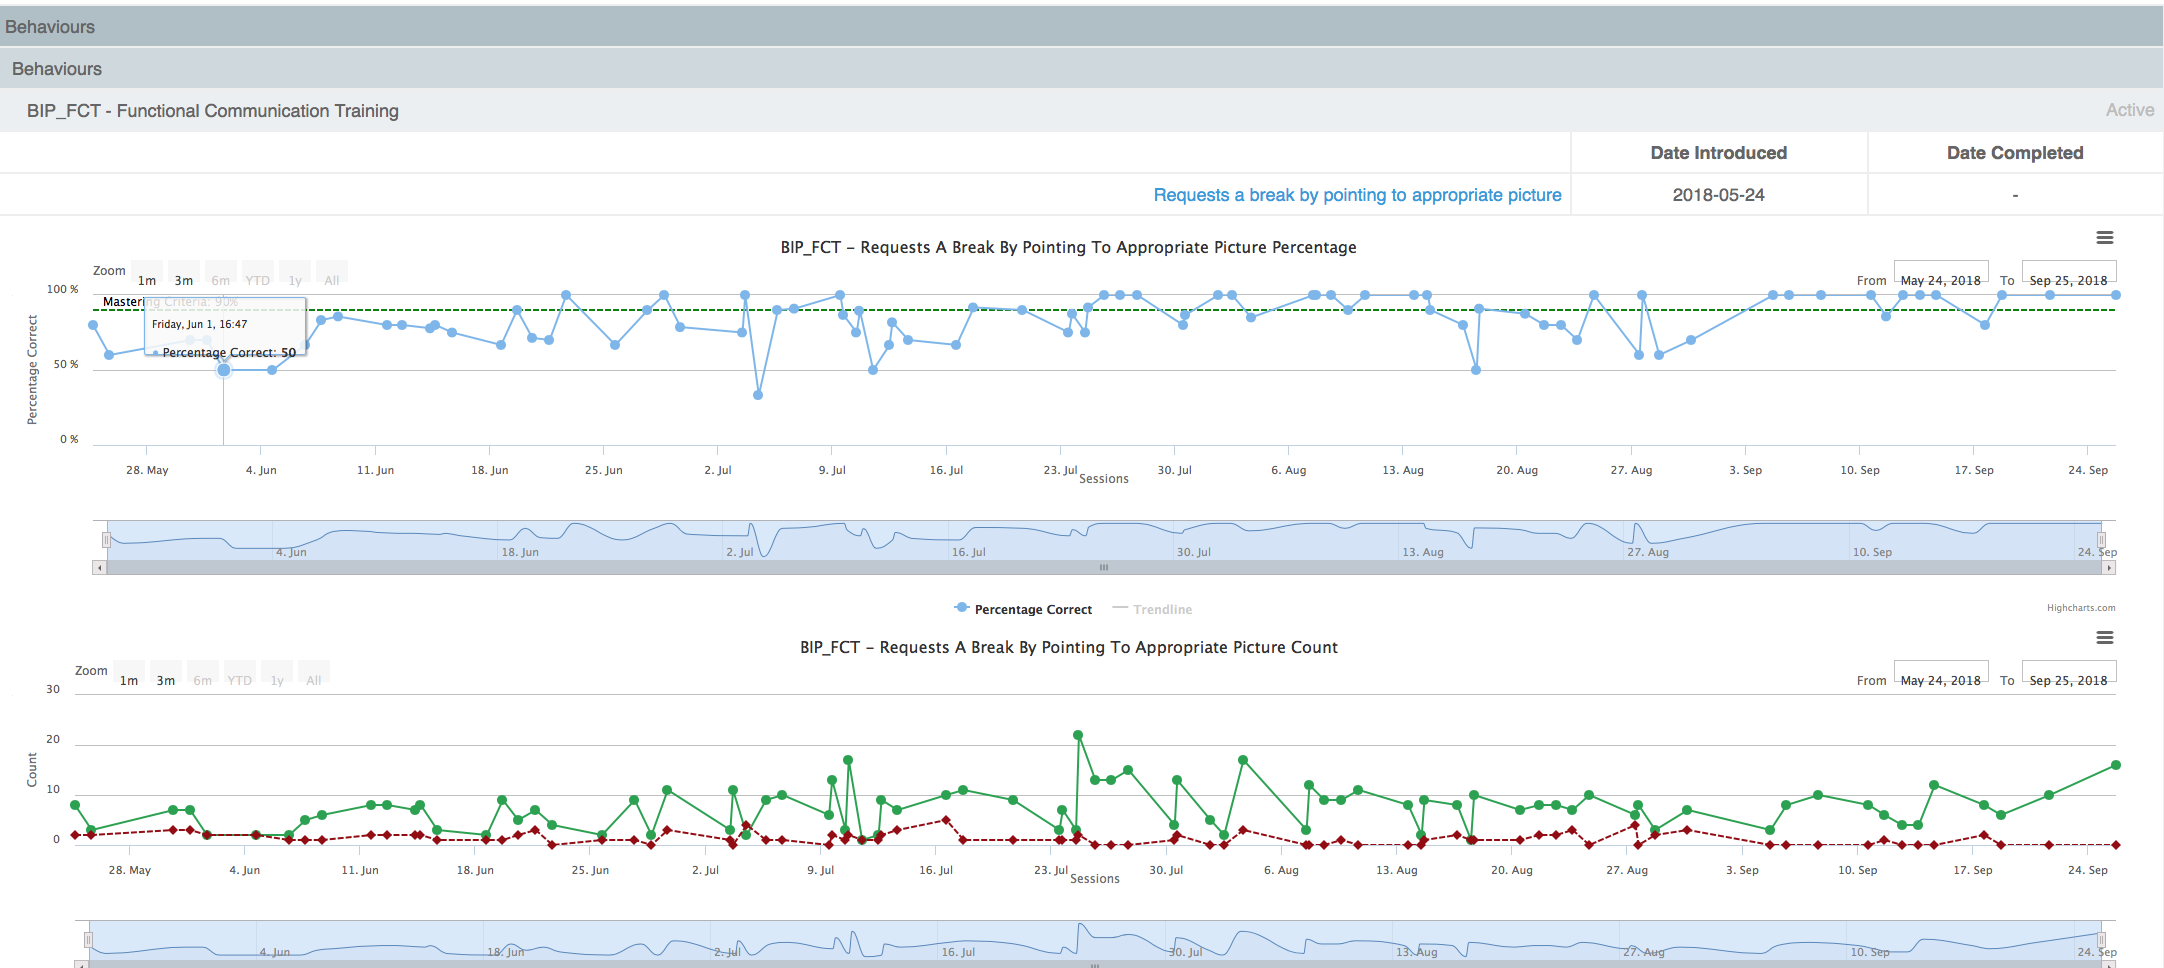
Behavior Deceleration
This report allows you to view data for tasks that are set as behavior deceleration and have a BIP in place.
Learner Program report
Displays a list of Tasks from the learner's active and completed tasks. Providing the following information for each task code - name, domain / skill-category, full teaching procedure if provided, list of target in their states.